Summary: Nodes in brain networks from fMRI are usually defined using ROI’s (Regions of Interest) so that each ROI node has a time series that is the average of the BOLD time series of the ROI’s voxels and links represent correlations between nodes. Here, we show that this averaging of voxel time series is problematic.
The human brain is a complex network of neurons. The problem is that there are about 10^12 of them with ~10^5 outgoing connections each; mapping out a network of this scale is not possible. Therefore, one needs to zoom out and look at the coarse-grained picture. This coarse-grained picture can be anatomical – a map of the large-scale wiring diagram between parts of the brain – or functional, indicating which parts of the brain tend to become active together under a given task.
But how should this coarse-graining be done in practice? How to define the nodes of a brain network –– what should brain nodes represent? In functional magnetic resonance imaging (fMRI), the highest level of detail is determined by the imaging technology. In a fMRI experiment, subjects are put inside a scanner that measures the dynamics of blood oxygenation in a 3D representation of the brain, divided into around 10,000 volume elements (voxels). Blood oxygenation is thought to correlate with the level of neural activity in the area. As each voxel contains about 5.5 million neurons, the network of voxels is significantly smaller than the network of neurons. However, it is still too large for many analysis tasks, and further coarse-graining is needed.
A typical way in the fMRI community is to group voxels into larger brain regions that are for historical reasons known as Regions of Interest (ROIs). This can be done in many ways, and there are many pre-defined maps (“brain atlases”) that define ROIs; these maps are based on anatomy, histology, or data-driven methods. It is common to use ROIs as the nodes of a brain functional network. The first step in constructing the brain network is to assign to each ROI a time series that is the average of the time series of its voxels measured in the imaging experiment. Then, to get the links, similarities between the ROI time series are calculated, usually with the Pearson correlation coefficient. The correlation between the two ROIs becomes their link weight. Often, only the strongest correlations are retained, and weak links are pruned from the network.
If the ROI approach is to work, the ROIs should be functionally homogeneous: their underlying voxels should behave approximately similarly. Otherwise, it is not clear what the brain network represents. Because this assumption hasn’t really been tested properly and because it is fundamentally important, we recently set out to explore whether it really holds.
We used resting-state data – data recorded with subjects who are just resting in the scanner, instructed to do nothing – to construct functional ROI-level networks based on some available atlases. We defined a measure of ROI consistency that has a value of one if all the voxels that make up the ROI have identical time series (making the ROI functionally homogeneous, which is good), and a value of zero if the voxels do not correlate at all (making that ROI a bad idea, in general).
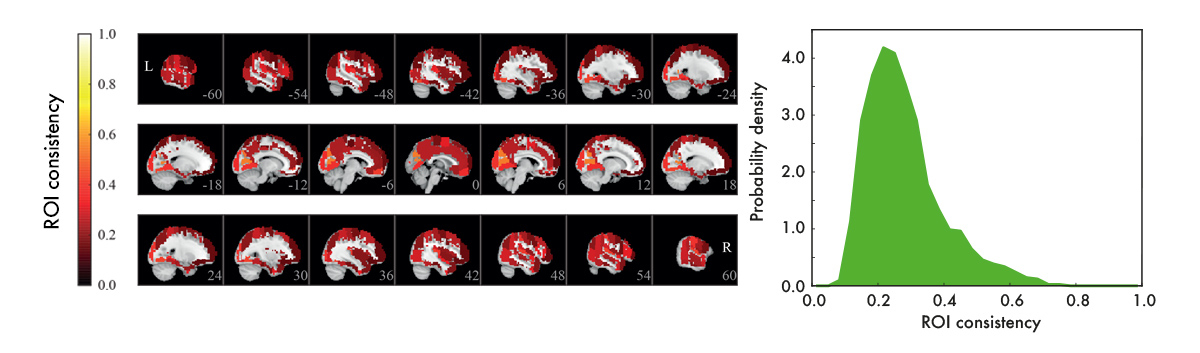
[Figure from our paper in Network Neuroscience]
We found that consistency varied broadly between ROIs. While a few ROIs were quite consistent (values around 0.6), many were not (values around 0.2). There were many low-consistency ROIs in three commonly used brain atlases.
From the viewpoint of network analysis, the existence of many low-consistency ROIs is a bit alarming. We also observed strong links between low-consistency ROIs – how should this be interpreted? These links may be an artefact, as they disappear if we look at the voxel-level signals. This means that the source of the problem is probably the averaging of voxel signals into ROI time series. While this averaging can reduce noise, it can also remove the signal: at one extreme, if one subpopulation of voxels goes up while another goes down, the average signal is flat. More generally, if a ROI consists of many functionally different subareas, their average signal is not necessarily representative of anything.
In conclusion, we would recommend being careful with functional brain networks constructed using ROIs; at least, it would be good to go back to the voxel-level data to verify that the obtained results are indeed meaningful.
For details, see our recent paper in Network Neuroscience.
This post was co-written by Onerva Korhonen, Enrico Glerean & Jari Saramäki.
[PS: The definition of brain network nodes is not the only complicated issue in the study of functional brain networks. Even before one has to worry about node selection, a possible distortion has already taken place: preprocessing of the measurement data. We’ll continue this story soon.]