In mathematics, the art of proposing a question must be held of higher value than solving it. –Georg Cantor
It can be said with complete confidence that any scientist of any age who wants to make important discoveries must study important problems. Dull or piffling problems yield dull or piffling answers. It is not enough that a problem should be ‘interesting‘—almost any problem is interesting if it is studied in sufficient depth. —P. B. Medawar
Choosing which problems to work on is perhaps the hardest and most crucial part of science. It is also an invisible and underrated part. In university, we are taught to solve problems that someone has designed for us to solve. I’ve yet to see an exam where the task is to invent a problem rather than solve one! But without problems, there are no solutions either. Problems come first, and solutions are only meaningful when the problems themselves are meaningful.
Despite this, solutions and the clever methods we develop to achieve them tend to take center stage when we write up our research. While we typically provide a post hoc justification for our research question in the introduction, convincing the reader why it is important, we practically never document how we actually chose that problem over a large number of others.
How did we search for the problem? How did we identify it? Was it already circulating in the literature, known to others as well? Did it come to us suddenly in a flash of inspiration — this would be a great problem to study? Did we have an intuitive feeling that if we begin to chip away at this problem, something useful will emerge? Or did we accidentally stumble upon some results, only later realizing what problem they actually solve? There are several ways of arriving at a research problem.
While having a lot of experience in one’s field is of course useful for identifying great problems, not knowing everything can also be an advantage. Creativity thrives when unexpected connections are made, and knowing too much can lead to to tunnel vision. This is why it might be a good idea to switch fields once or twice during your career… Of course, if you know nothing, it’s not possible to invent meaningful problems, and if you know too little, you might come up with problems that others have already solved. So know your literature, but don’t be afraid to set your own research goals, not solely relying on what everyone else thinks is important.
When doing a Ph.D., start developing the skill of inventing meaningful scientific problems from day one! This investment pays off compound interest: the better problems you invent, the more doors your results open, leading to even better questions.
Often, a good research problem is like a seed: plant it in fertile soil, tend to it well, and more great problems will sprout.
Let’s now suppose that you have a list of candidate problems—research questions that you might well like to study. Which one should you pick? What does a great research problem look like? First, let’s impose some real-world constraints.
Of course, the problem should be important, and its solution should make a difference. But it also needs to be solvable—impossible problems are not worth it, especially if you’re trying to finish a Ph.D. Still, problems may look deceptively easy, and it’s probably safe to say that the large majority of problems are more difficult than they first appear.
Since there is a finite time in which the Ph.D. has to be completed, it might be wise to mitigate risk by balancing your more ambitious endeavors with some “safe” problems that guarantee results. It is also good to have a plan B for getting something publishable out of problems that are too hard or too slow to completely crack. Then there is always material to write about, even if the more grandiose undertakings fail or take one to several lifetimes to complete.
Therefore “finding a cure for cancer” or “developing an artificial brain” do not qualify as great research problems for your Ph.D. Rather, they are long-term targets of entire fields of science. However, “figuring out the role of pathway X in preventing our immune cells to attack tumours” or “understanding the role of criticality in the prediction power of liquid-state machines” could be steps in the right direction.
Confession: I made these up sort of randomly (though not entirely randomly). Yet both are focused or at least focused and concrete enough that one could actually start attacking them from some experimental or theoretical angle.
Thus far, we’ve covered the easy part—problems should be concrete and solvable, and impossible problems should better be left alone. But not all concrete, solvable problems are worth solving. The elephant left in the room is importance. What makes a problem important? And what does that even mean?
Of course, your results might yield obvious and direct benefits—perhaps contributing to a new medical treatment or laying the groundwork for future advancements in artificial intelligence. However, most of the time, “importance” is a more elusive concept. It’s usually easier to assess the significance of a result after the fact: if a scientific article is highly cited, it likely had a substantial impact on other scientists’ thinking.
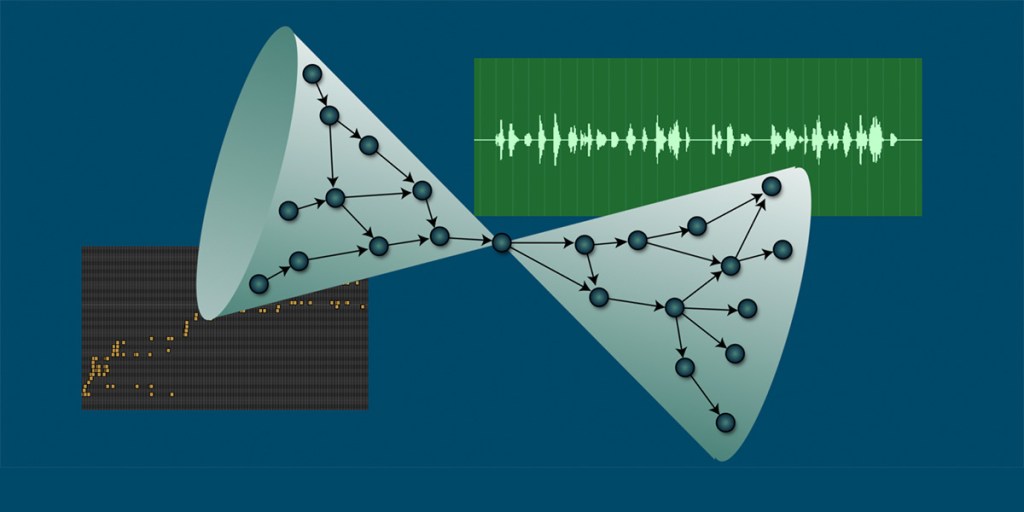
When we move from concrete outputs like articles to the more abstract and hazy realm of ideas, one way to visualize science is as an ever-growing network where ideas give birth to new ideas. An impactful idea is one that sparks many others downstream, either directly as offspring or indirectly through a chain of intermediate concepts. This latent process is what generates the aforementioned citations: ideas spawning ideas, and, in a Darwinian sense, great ideas giving rise to more ideas.
Unlike in biology, however, an idea can have far more than two parents, and its fitness isn’t always immediately apparent—there can be a long delay before its importance is recognized. And unfortunately, sometimes the building blocks that had to be put in place before a major new idea could emerge are forgotten. Everyone knows about Einstein’s theory of relativity, but few are aware of all the earlier efforts that went into developing ways to synchronize clocks across countries and continents using electric cables. Yet Einstein was undoubtedly familiar with this work, and it must have influenced his way of thinking.
In any case, even if assessing the importance of a research question is not trivial, it is worth asking why someone would cite your results, say, 10 years down the line. Is the question fundamental enough so that if you solve it, others will build on your results? Try to see the question as part of a bigger tapestry.
The above picture of science as a flow of ideas being born, merging, and mutating is also helpful for reviewing the literature, both for coming up with research questions and understanding what has already been done in the general vicinity of a question that you have chosen to address. Science is a network—to make discoveries, follow the links of that network!
Identify impactful and highly cited papers and try to figure out why they are important. Then, use Google Scholar or some other tool to find out who cites them; just look at the abstracts of the citing papers to get the big picture and then dive into the details of those pieces of work that sound relevant to you. This is, in my view, a more useful way than trying to read all the literature in detail, in some random order. Try to first see the forest from the trees, and then focus on those trees that you find important. If you feel that some trees or entire forests are missing, you have a research question!